Process capability
From Wikipedia, the free encyclopedia
A process is a unique combination of tools, materials, methods, and people engaged in producing a measurable output; for example a manufacturing line for machine parts. All processes have inherent statistical variability which can be evaluated by statistical methods.
The Process Capability is a measurable property of a process to the specification, expressed as a process capability index (e.g., Cpk or Cpm) or as a process performance index (e.g., Ppk or Ppm). The output of this measurement is usually illustrated by a histogram and calculations that predict how many parts will be produced out of specification (OOS).
Process capability is also defined as the capability of a process to meet its purpose as managed by an organization's management and process definition structures ISO 15504.
Two parts of process capability are: 1) Measure the variability of the output of a process, and 2) Compare that variability with a proposed specification or product tolerance.
Contents[hide] |
..

| 6. Process or Product Monitoring and Control
6.1. Introduction
| |||||||||||||||||||||
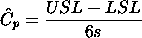
| Process capability compares the output of an in-control process to the specification limits by using capability indices. The comparison is made by forming the ratio of the spread between the process specifications (the specification "width") to the spread of the process values, as measured by 6 process standard deviation units (the process "width"). Process Capability Indices | |||||||||||||||||||||
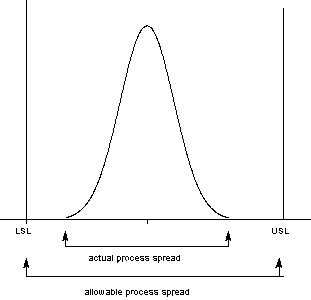
| A process capability index uses both the process variability and the process specifications to determine whether the process is "capable" | We are often required to compare the output of a stable process with the process specifications and make a statement about how well the process meets specification. To do this we compare the natural variability of a stable process with the process specification limits. A capable process is one where almost all the measurements fall inside the specification limits. This can be represented pictorially by the plot below:
There are several statistics that can be used to measure the capability of a process: Cp, Cpk, Cpm. Most capability indices estimates are valid only if the sample size used is 'large enough'. Large enough is generally thought to be about 50 independent data values. The Cp, Cpk, and Cpm statistics assume that the population of data values is normally distributed. Assuming a two-sided specification, if | ||||||||||||||||||||
| Definitions of various process capability indices | 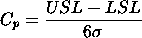
| ||||||||||||||||||||
| Sample estimates of capability indices | Sample estimators for these indices are given below. (Estimators are indicated with a "hat" over them).
The estimator for Cpk can also be expressed as Cpk = Cp(1-k),where k is a scaled distance between the midpoint of the specification range, m, and the process mean, Denote the midpoint of the specification range by m = (USL+LSL)/2. The distance between the process mean, 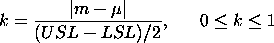 (the absolute sign takes care of the case when The estimator for the Cp index, adjusted by the k factor, is 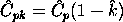 Since | ||||||||||||||||||||
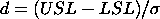
| Plot showing Cp for varying process widths | To get an idea of the value of the Cp statistic for varying process widths, consider the following plot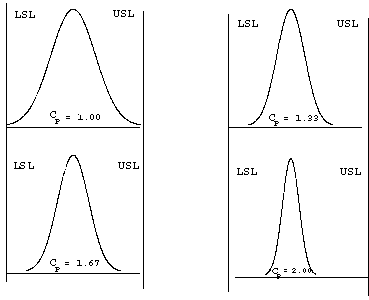 | ||||||||||||||||||||
| Translating capability into "rejects" |
where ppm = parts per million and ppb = parts per billion. Note that the reject figures are based on the assumption that the distribution is centered at We have discussed the situation with two spec. limits, the USL and LSL. This is known as the bilateral or two-sided case. There are many cases where only the lower or upper specifications are used. Using one spec limit is called unilateralor one-sided. The corresponding capability indices are | ||||||||||||||||||||
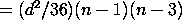
| One-sided specifications and the corresponding capability indices | 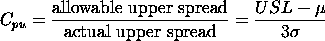 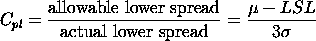  and and  are the process mean and standard deviation, respectively. are the process mean and standard deviation, respectively.Estimators of Cpu and Cpl are obtained by replacing Cp = (Cpu + Cpl) /2.This can be represented pictorially by 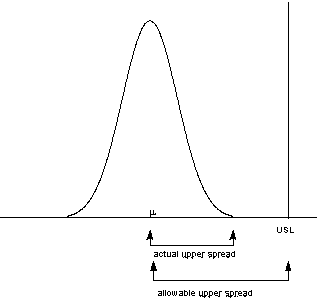 Note that we also can write:
| ||||||||||||||||||||
| Confidence Limits For Capability Indices | |||||||||||||||||||||
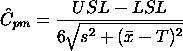
| Confidence intervals for indices | Assuming normally distributed process data, the distribution of the sample  follows from a Chi-square distribution and follows from a Chi-square distribution and  and and  have distributions related to the non-central tdistribution. Fortunately, approximate confidence limits related to the normal distribution have been derived. Various approximations to the distribution of have distributions related to the non-central tdistribution. Fortunately, approximate confidence limits related to the normal distribution have been derived. Various approximations to the distribution of The resulting formulas for confidence limits are given below: 100(1-  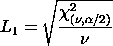 
| ||||||||||||||||||||
| Confidence Intervals for Cpu and Cpl | Approximate 100(1- )% confidence limits for Cpu with sample size n are: )% confidence limits for Cpu with sample size n are:![C(pu)(lower) = Chat(pu)-z(1-beta)*SQRT[(1/(9*n))+Chat(pu)^2/(2*(n-1))]](http://www.itl.nist.gov/div898/handbook/pmc/section1/eqns/cpulow.gif)
 is not known, set it to . is not known, set it to .Limits for Cpl are obtained by replacing | ||||||||||||||||||||
| Confidence Interval for Cpk | Zhang et al. (1990) derived the exact variance for the estimator of Cpk as well as an approximation for large n. The reference paper is Zhang, Stenback and Wardrop (1990), "Interval Estimation of the process capability index", Communications in Statistics: Theory and Methods, 19(21), 4455-4470. The variance is obtained as follows: Let ![c = SQRT(n)*[mu - (USL+LSL)/2]*sigma](http://www.itl.nist.gov/div898/handbook/pmc/section1/eqns/cpvar1.gif)

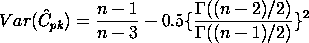  = 25, 0.75 <= Cpk <= 4, |c| <= 100, and d <= 24"> = 25, 0.75 <= Cpk <= 4, |c| <= 100, and d <= 24">![C(pk) = Chat(pk) +/- z(1-alpha/2)*SQRT[(1/(9*n)) + Chat(pk)^2/(2*(n-1))]](http://www.itl.nist.gov/div898/handbook/pmc/section1/eqns/cpkvar3.gif)  ="> 100 for capability studies. Another point to observe is that variations are not negligible due to the randomness of capability indices. ="> 100 for capability studies. Another point to observe is that variations are not negligible due to the randomness of capability indices. | ||||||||||||||||||||
| Capability Index Example | |||||||||||||||||||||
| An example | For a certain process the USL = 20 and the LSL = 8. The observed process average,  = 16, and the standard deviation, s = 2. From this we obtain = 16, and the standard deviation, s = 2. From this we obtain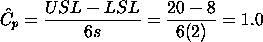 But it doesn't, since 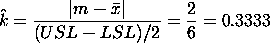 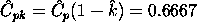  at least 1.0, so this is not a good process. If possible, reduce the variability or/and center the process. We can compute the and at least 1.0, so this is not a good process. If possible, reduce the variability or/and center the process. We can compute the and 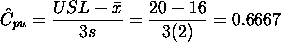
, which is the smallest of the above indices, is 0.6667. Note that the formula is the algebraic equivalent of the min{, } definition. | ||||||||||||||||||||
| What happens if the process is not approximately normally distributed? | |||||||||||||||||||||
| What you can do with non-normal data | The indices that we considered thus far are based on normality of the process distribution. This poses a problem when the process distribution is not normal. Without going into the specifics, we can list some remedies.
There is, of course, much more that can be said about the case of nonnormal data. However, if a Box-Cox transformation can be successfully performed, one is encouraged to use it. | ||||||||||||||||||||
![Cpk = MIN[(USL-mu)/(3*sigma), (mu-LSL)/(3*sigma)]](http://www.itl.nist.gov/div898/handbook/pmc/section1/eqns/cpkdef.gif)

![Chat(pk) = MIN[(USL-m)/(3*s), (m-LSL)/(3*s)]](http://www.itl.nist.gov/div898/handbook/pmc/section1/eqns/cpkdef2.gif)
 . The scaled distance is
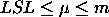 ). To determine the estimated value,
  , we estimate
  . Note that
  .
. , it follows that
  .
. = degrees of freedom
![C(pu)(upper) = Chat(pu)+z(1-alpha)*SQRT[(1/(9*n))+Chat(pu)^2/(2*(n-1))]](http://www.itl.nist.gov/div898/handbook/pmc/section1/eqns/cpuupp.gif)
 by
by  .
.
![Phi(-c) = integral[-infinity to -c][(1/(SQRT(2(*PI))*EXP(-5*z**2 dz]](http://www.itl.nist.gov/div898/handbook/pmc/section1/eqns/cpvar3.gif)
![-(d/(9*SQRT(n))*(n-1)*(n-3)*{SQRT(2*PI)* EXP(-c**2/2) + c[1 - 2*PHI(-c)]}](http://www.itl.nist.gov/div898/handbook/pmc/section1/eqns/cpvar6.gif)
![+[(1/9)*(n-1)/(n*(n-3))]*(1+c**2)](http://www.itl.nist.gov/div898/handbook/pmc/section1/eqns/cpvar7.gif)
![-[(n-1)/(72n)]*{(GAMMA((n-1)/2))/(GAMMA((n-1)/2))}**2](http://www.itl.nist.gov/div898/handbook/pmc/section1/eqns/cpvar8.gif)
![*{d*SQRT(n) - 2*SQRT(2*PI)*EXP(-c**2/2) - 2*c*[1 - 2*PHI(-c)]}**2](http://www.itl.nist.gov/div898/handbook/pmc/section1/eqns/cpvar9.gif)
![Chatnpk = min[(USL - median)/(p(0.995) - median), (median - LSL)/(median - p(0.005))]](http://www.itl.nist.gov/div898/handbook/pmc/section1/eqns/cnpk.gif)

source
| 3. Production Process Characterization
3.4. Data Analysis for PPC
| |||
| Capability compares a process against its specification | Process capability analysis entails comparing the performance of a process against its specifications. We say that a process is capable if virtually all of the possible variable values fall within the specification limits. | ||
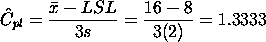
| Use a capability chart | Graphically, we assess process capability by plotting the process specification limits on a histogram of the observations. If the histogram falls within the specification limits, then the process is capable. This is illustrated in the graph below. Note how the process is shifted below target and the process variation is too large. This is an example of an incapable process. | ||
| Notice how the process is off target and has too much variation | 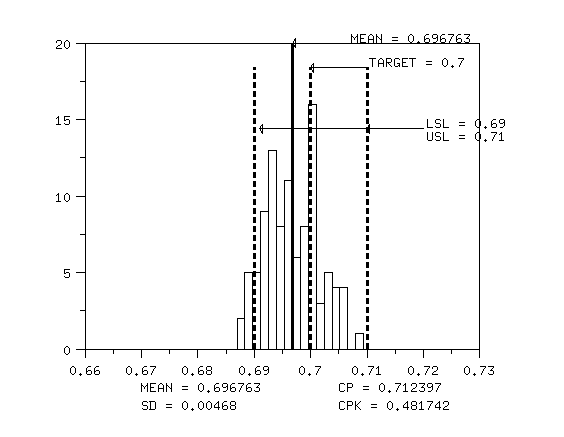 | ||
| Numerically, we measure capability with a capability index. The general equation for the capability index, Cp, is: | |||
| Numerically, we use the Cpindex |  | ||
| Interpretation of the Cpindex | This equation just says that the measure of our process capability is how much of our observed process variation is covered by the process specifications. In this case the process variation is measured by 6 standard deviations (+/- 3 on each side of the mean). Clearly, if Cp> 1.0, then the process specification covers almost all of our process observations. | ||
| Cp does not account for process that is off center | The only problem with with the Cp index is that it does not account for a process that is off-center. We can modify this equation slightly to account for off-center processes to obtain theCpk index as follows: | ||
| Or the Cpkindex | ![Cpk = min[(USL-xbar)/3*s, (xbar - LSL)/3*s]](http://www.itl.nist.gov/div898/handbook/ppc/section4/gifs/Image2.gif) | ||
| Cpk accounts for a process being off center | This equation just says to take the minimum distance between our specification limits and the process mean and divide it by 3 standard deviations to arrive at the measure of process capability. This is all covered in more detail in the process capability section of the process monitoring chapter. For the example above, note how the Cpk value is less than the Cp value. This is because the process distribution is not centered between the specification limits. | ||
source


.jpg)


.jpg)

.jpg)


.jpg)

.jpg)


)
.jpg)


.jpg)


.jpg)

.jpg)


.jpg)


.jpg)


.jpg)


.jpg)


No comments:
Post a Comment